

UL White Paper: Getting More Reliability in PV Installations
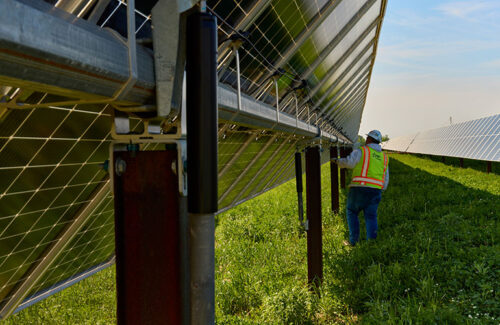
Photovoltaic (PV) module manufacturers, installers and project owners share a common interest in the long-term performance of PV installations. In evaluating the reliability of a PV system, it is important to focus not just on the PV module but on the entire system. An installed PV system can provide the expected level of service only if all of its components, from the solar cell to the connection to high voltage transmission line, perform as expected, and if the entire PV system is properly maintained.
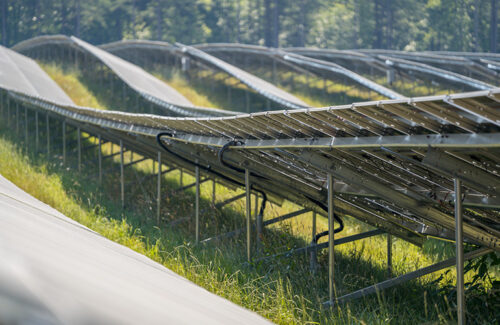
Specific properties of PV system installation sites, such as ambient conditions, equipment temperatures, soiling and contamination can also have a direct impact on the performance and expected life of a given installation, and can contribute to different site-specific degradation rates. In addition, the ongoing consolidation of the PV industry may result in the demise of some manufacturers, undercutting the potential benefits of manufacturers’ warranties. To avoid these problems, PV manufacturers should adopt a holistic quality control protocol to address key issues such as sampling rates, test plans and test durations.
This white paper discusses various testing methods that can be used by manufacturers and customers to assess the reliability of PV modules in real-world conditions. It reviews the importance of both module durability and reliability in PV system performance, and discusses the drawbacks of theoretical models of life expectancy in assessing module reliability.
It then presents a framework for assessing module PV reliability and illustrates how three different tests can provide meaningful module reliability data in the context of an ongoing quality inspection program.
Theoretical Approaches to Estimating Service Life
The task of modelling the lifetime or lifetime cycles of PV modules is based on a number of assumptions. These assumptions are combined with lab-measured data and, to some extent, information from field experience and product returns from the field. However, the photovoltaic industry is relatively new, rapidly changing and focused on increased efficiency, i.e., higher efficient cells, new materials, new designs, etc. In contrast, PV lifetime expectations can range from 20 to 30 years. These factors significantly limit the availability and value of data that can be used today to predict expected PV service life.
To answer important questions regarding PV modules’ service life, accelerated aging test protocols are often used. From these tests, activation energy (Ea) can be determined by using an Arrhenius-approach. Typically Ea measurements for temperature, humidity and ultraviolet (UV) are identified and used for first life time prediction calculations.1,2,3,4 Eas, combined with local weather data, provide the basis for those calculations of an anticipated service life.
However, the basic problem with this approach is that it relies on the triggering of a single failure mechanism only. In reality, a combination of different concurrent degradation mechanisms occurs, along with random and location- specific weather-related events (wind, wind gusts, storms, snow, ice and hail) that are nearly impossible to predict.
Figure 1 illustrates different observed power loss curves for an assortment of PV modules (dotted lines), together with possible step-warranty curves (blue and orange lines). The green and red curves shown are arbitrarily-combined degradation curves, with each curve the result of three separate factors. The key question posed in this illustration is which of the two step-warranty curves (the orange or the blue) more closely aligns with actual lifetime performance.

Figure 1: Various degradation rates vs. warranty promises on an arbitrary time scale
To improve on the theoretical approach for estimating PV lifetimes, it is necessary to understand the interaction between various environmental conditions and the observed impact that each of these conditions has on PV modules. This requires the collection of performance data from various locations, and an analysis of the data to determine possible root causes for failures. Table 1 lists various environmental parameters and displays some observed affects that result in PV module failures.

The durability of a PV module is a byproduct of its design. PV module reliability, on the other hand, is dependent on the quality and integrity of the process used to manufacture the module. Even small variations in material quality or manufacturing processes can impact the reliability of a component.
Testing and certification of a PV module to the requirements of a given standard typically focuses on verifying that the fundamental design requirements have been fulfilled. A different battery of long-term stress tests and test-to-fail protocols have been proposed to verify the durability of PV modules.5, 6, 7
It is often assumed that such long-term testing also assesses the reliability of a PV module, but reliability testing verifies that a product has been consistently produced within the original design parameters. Reliability testing increases confidence in production quality, and usually takes less time and costs less than durability tests.
To be effective, reliability testing requires checking more than just one or two samples. An industry-based standard, such as ISO 2859-1,8 can provide guidance on how to select and evaluate production samples, as well as the criteria that can be used to determine whether a batch of tested products should be accepted. Based on an actual history of sample acceptance and rejection, a more or less stringent sampling plan can be used.
However, given their importance in the reliable operation of PV systems, more sophisticated quality checks are necessary when it comes to PV modules. Table 2 illustrates the range of tests in ISO 2859-1, including:
- Number of samples to be evaluated by inspection level (S1-S4 and G1-G3) and the size of the PV project
- Acceptance quality level (AQL)
- Allowed percentage of failed samples

The number of samples to be evaluated assumes a statistical distribution of product variations. The AQL defines the confidence in accepting or rejecting a given batch of samples. For some critical tests like safety, a low AQL (such as 0.1, for example) would signify no tolerance for failures (zero-failure tolerance). In other tests, such as those used to assess visual defects like misaligned cells, higher AQLs may be acceptable. Industry standards often provide baseline pass/fail.
Note: The table shows proposed inspection level, number of samples required for each test and the number of module failures allowed following ISO 2859-1. Entries for “a)” refer to a 1MW plant, “b)” to a 10MW plant, and “c)” to a 50MW plant using 240W modules).15
UL’s own suite of test offerings include short-term quality tests as described above, as well as extended versions of each test to evaluate long-term durability or test-to-fail limits. Table 3 provides an overview and a brief description of each test as well as the PV technology to which each test is applicable.

Details of Selected Tests
The following sections discuss selected reliability tests for PV modules, and illustrate their potential value in assessing PV module reliability. It is important to note that, while these tests are not overly time-consuming or costly, they require the evaluation of a minimum number of samples in order to produce statistically significant results.
Flash test
The flash test is an efficient way to verify the output power of PV modules within a given range of uncertainty. The uncertainty is primarily driven from the spectral response of a given PV module, the used light source and general measurement uncertainties from the calibration chain. The last uncertainty is usually constant, but the first two can result in a significant impact on absolute measurements, especially for thin film technologies.
Aside from these limitations, the flash test can be used to investigate the following areas associated with module reliability:
- Determination of initial power loss resulting from preconditioning
- Production flash list verification
- Verification of name plate rating
These three factors are critical for any valid yield estimation. To achieve even greater levels of confidence in yield estimation, it’s best to rely on measured data from the actual PV modules that will be used initial power loss of the solar cell. The average initial degradation is typically below 1% for polycrystalline cells, but could be as great as 5% for monocrystalline cells. Figure 2a illustrates the potential spread in actual values of initial power loss. However, in an installation with several thousand modules, this spread is averaged out over all of the modules.
Production flash list verification is an important first step in selecting a PV module manufacturer. The production flash list verification compares the measured power output parameters from production with labeled values as well as those derived from third-party measurements. This verification validates the calibration chain of the PV module manufacturer. Flash list verifications are typically conducted on at least 20 individual modules to assure a normal distribution of defects and to lower uncertainty. Generally higher measurement uncertainties should be taken into account in cases where fewer modules are being tested.
PV modules are usually sold on the basis of their name plate rating. The Watt rating that appears on a PV module nameplate is used in conducting energy yield simulations, which means that accurate nameplates are a critical factor in achieving the energy yields predicted for a given installation. Consistent with the requirements of standards EN 50380 and UL 4730, <sup9, 10,the ratings that appear on name plates must account for all initial degradation or light soaking effects. Therefore, PV modules should be stabilized prior to measurement, and the measurement should be compared with the rating that appears on the name plate.

An example of name plate rating values is illustrated in Figure 2b. In this instance, the actual power measured is about 2.2% below stated name plate rating. Such a discrepancy would likely result in a gap between anticipated and actual power output.
Electro-luminescence: Failure detection and mapping
A second evaluation method, electro-luminescence (EL) imaging, is primarily used for crystalline silicon PV modules because there is widespread acceptance of the types of module defects that are visible using this method.11,12 There are several different types of defects that can be identified with EL imaging, each with its own root cause and performance impact. Evaluating EL images according to commonly prescribed methods can provide useful information regarding PV module reliability.
Figure 3 shows two modules, each with a different number of cracks with varying degrees of severity. Modules similar to those depicted in module no. 1 are usually acceptable and can reliably generate power. Modules similar to those depicted in module no.2 often exhibit inactive areas after a short period of time, leading to severe power losses.

Figure 4: Failure mapping using Electro-luminescence to detect production variations between shipments. Shipment #1 shows a normal, randomly distribution of some defects. In contrast, shipment no. 2 shows 5X more defects with some locally very high number of defects e.g. cell J-5.
By evaluating multiple images from a single batch, it is possible to determine a general level of quality from the number and distribution of defects. An illustration of such an evaluation is presented in Figure 4. Each shipment includes the same number of modules. In shipment No. 1, only a few randomly distributed defects were identified, representing an acceptable result. However, in shipment No. 2, the number of defective modules has dramatically increased, and defects and cell cracks appear concentrated in the region I4 to J5.

Together, these observations point to a significant issue, either in the manufacturing process, the transportation of completed modules, or both. In any event, the results depicted in shipment
No. 2 are not acceptable, and further investigation is warranted to identify root causes. Additional actions could include an EL inspection of all modules prior to installation, or more frequent inspection and testing of PV systems already in operation.
Potential Induced Degradation
At present, potential induced degradation (PID) is primarily associated with crystalline modules. Although a number of c-Si module manufacturers are now offering PV modules that are purportedly PID resistant, PID remains an unsolved problem. Efforts to address PID are further complicated by the use of different test procedures and comparability metrics, as well as a lack of data about the links between PID and recovery effects.
Unfortunately thin-film PV modules are also not always resistant to potentials vs. ground. Early thin-film modules exhibited a number of problems with transparent conductive oxide (TCO) corrosion (also known as bar graph corrosion), a clearly visible defect. But today’s thin-film modules can also exhibit severe PID, a condition that is not as easily detected by standard test protocols.13
The focus of PID testing can vary, depending on the desired outcomes. However, some options include:
- Screen PV modules for PID susceptibility
- Shipment-to-shipmentverification for PID susceptibility
- Screening of module materials (cells and encapsulants)
- Standard testing conditions (STC) and low-light performance testing after PID testing
The first item on this list may seem obvious, but the additional options can provide further insights into long-term module reliability, enabling more expeditious actions to identify and address PID.
Figure 5 illustrates the results of a PID screening test of three types of modules from different manufactures. Type 1 modules show a nearly linear degradation over time with different susceptibilities. The Type 2 module shown is actually an extreme case of a Type 1 module, since it quickly reaches 100% of possible degradation and cannot degrade further over time. Type 3 modules are typically stable during the first phase of the PID test, but begin to degrade quickly once they reach a certain threshold of potential application. It is crucial to find out the general behavior (Type 1 or 3) under continuous laboratory voltage stress tests, but also to investigate recovery aspects of the module and possible system-related options.16

Since PV modules can produce such widely different results, it is important to set reasonable test parameters. Selected parameters might depend on prior knowledge of the module type or the actual scope of the test, for example, quality check or durability investigation. UL’s own default test program subjects modules to system voltage for two weeks by applying the potential via a conductive foil, resulting in a homogeneous screening of the entire module and all of its solar cells. This default set of parameters can be adjusted and customized to address the specific needs of a given project.
Summary and Conclusion
In an increasingly competitive marketplace, manufacturers are expected to provide customers with PV modules that meet promised performance specifications. Consistent module reliability depends on the quality and integrity of the manufacturing process, and even small variations can adversely impact the reliability of a component and compromise PV system performance. An effective, statistically-relevant reliability testing protocol can help identify modules that fail to meet design specifications, thereby providing customers with greater assurances that expected PV system performance is actually achievable.
UL has consolidated years of PV industry research to develop proven scientific test procedures to screen PV modules for reliability, performance and safety. UL’s performance and reliability services for PV modules provide third-party evidence of industry standard testing to assess consistency in the manufacturing process that also includes technical inspections of PV module factory operations. Additional tests can be conducted to demonstrate the impact of long-terms stresses on PV module performance and safety.
1 “Development and application of a UV light source for PV-module testing,” M. Koehl, et al, 24th European Photovoltaic Solar Energy Conference (2009). Web. 8 April 2014. http://www.eupvsec-proceedings.com/roceedings?paper=4697.
2 “Reliability of PV-modules – Natural, accelerated and simulated degradation,” M. Koehl, et al, SPIE Conference 7048-4, September 2008. Web. 8 April 2014. http://www.iea-pvps.org/index.php?id=15&eID=dam_frontend_push&docID=272.
3 “System voltage potential-induced degradation mechanisms in PV Modules and Methods for Test,” P. Hacke, et al, 37th IEEE Photo- voltaic Specialists Conference (2011). Web. 8 April 2014. http://ieeexplore.ieee.org/xpl/articleDetails.jsp?arnumber=6186079&sortTy pe%3Dasc_p_Sequence%26filter%3DAND%28p_IS_Number%3A6185829%29%26pageNumber%3D6%26rowsPerPage%3D50.
4 “Accelerated Aging: Challenge, Opportunity and Necessity,” B. Jaeckel, et al, Photovoltaic Module Reliability Workshop 2011. Web. 8 April 2014. http://www.nrel.gov/docs/fy14osti/60170.pdf.
5 “Test-to-Fail of Crystalline Silicon Modules,” P. Hacke, et al, IEEE Photovoltaic Specialists Conference, 20-25 June 2010. Web. 8 April 2014. http://www.nrel.gov/docs/fy11osti/47755.pdf.
6 “Closing the loop: using production testing and field failure analysis to build reliable solar panels,” D. DeGraaff, Photovoltaic Interna- tional vol. 11, 2011. Web 8 April 2014. http://www.solarmediastore.com/closing-the-loop-using-production-testing-and-field-failure- analysis-to-build-reliable-solar-panels.html.
7 “Assessment of aging through periodic exposure to damp heat (85°C / 85 % RH) of seven different thin-film module types,” T. Sample, et al, 34th IEEE Photovoltaic Specialists Conference (2009). Web 8 April 2014. http://ieeexplore.ieee.org/xpl/articleDetails.jsp ?reload=true&arnumber=5411378.
8 ISO 2859-1: 1999, “Sampling procedures for inspection by attributes – Part 1: Sampling schemes indexed by acceptance quality limit (AQL) for lot-by-lot inspection.”
9 EN 50380:2003, “Datasheet and nameplate information for photovoltaic modules.”
10 UL 4730, “Nameplate, Datasheet, and sampling requirements of photovoltaic modules.”
11 M. Koentges, et al, “Elektrolumineszenzmessung an PV-Modulen“, Photovoltaik aktuell, 2008
12 “Looking into the Future,” B. Jaeckel, et al, pv magazine, October 2013. Web. 8 April 2014. http://www.pv-magazine.com/archive/ articles/beitrag/looking-into-the-future-_100012902/#axzz2ybGnZxOy.
13 “Estimation of Time to PID-failure by Characterisation of Module Leakage Currents,” P. Lechner, et al, 27th European Photovoltaic Solar Energy Conference (2012). Web. 8 April 2014. http://www.eupvsec-proceedings.com/proceedings?paper=18294.
14 “PV Module degradation under high potentials – A comparative study between test setups,” B. Jaeckel, et al, 28th European Photo- voltaic Solar Energy Conference (2013). Web. 8 April 2014. http://www.eupvsec-proceedings.com/proceedings?paper=25443.
15 “Lose ziehen,” B. Jaeckel, et al, pv magazine, Janaury 2013.
16 “Investigation of c-Si Modules Degradation and Recovery Effect under High Potentials,” B. Jaeckel, et al, 40th IEEE Photovoltaic Specialists Conference (2014) (to be presented)
参考译文:
光伏(PV)组件制造商,安装商和项目业主分享光伏发电装置的长期性能上有共同利益。在评估光伏系统的可靠性,它集中不仅PV模块上,但在整个系统上是很重要的。已安装的光伏系统可提供服务的预期水平只有当它的所有组件,从太阳能电池到连接到高压输电线路,达到预期效果,而如果整个光伏系统的妥善保养。
光伏系统安装地点,如环境条件,设备温度,污染和污染的具体性能还可以对性能有直接影响一个给定的安装和预期寿命,并有助于不同的位点特异性的降解率。此外,正在进行整合光伏产业可能会导致一些厂家的消亡,削弱了厂商的保修可能带来的好处。为了避免这些问题,光伏制造商应该采取一种全面的质量控制协议,以解决关键问题,如采样率,测试计划和测试时间。
本白皮书讨论了各种测试方法,可以用来制造商和客户评估在真实世界条件下光伏组件的可靠性。它回顾了这两个模块的耐久性和可靠性的光伏系统性能的重要性,并讨论了预期寿命的理论模型的缺陷评估模块的可靠性。
然后,它为评估光伏模块可靠性的框架,并说明了如何三种不同的测试可以在一个持续的质量检验程序的上下文提供有意义的模块可靠性的数据。
理论方法估算寿命
造型光伏组件的生命周期和寿命周期的任务是基于一些假设。这些假设条件相结合,与从现场经验和从场产物返回实验室测量的数据,并在一定程度上的信息。然而,光伏产业是相对较新的,迅速变化并集中于提高效率,即,更高效率的细胞中,新材料,新设计等相反,PV寿命期望的范围可以从20至30岁。这些因素限制了显著今天可以用来预测预期光伏使用寿命的可用性和数据的价值。
回答有关光伏模块的使用寿命很重要的问题,加速老化试验协议经常被使用。从这些测试中,活化能(Ea),可以通过使用阿仑尼乌斯-办法来确定。通常情况下的Ea测量温度,湿度和紫外线(UV)的确定和用于第一生命时间预测calculations.1,2,3,4 EAS,结合当地气象资料,提供基础的预期使用寿命的计算。
然而,基本的问题,这种方法是,它依赖于只有单一故障机制的触发。在现实中,不同的并发退化机制相结合时,伴随着随机的,与位置相关的天气事件(风,阵风,暴雨,雪,冰和冰雹),几乎是不可能预测。
图1示出了不同的观察功率损耗曲线的PV模块(虚线)的分类,以及可能的步骤,保证曲线(蓝色和橙色线)。所示的绿色和红色的曲线是任意组合的已退化的曲线,每个曲线的三个独立的因素造成的。提出本图中的关键问题是,这两个步骤保修曲线(橙色或蓝色)更加紧密地与实际寿命性能保持一致。
ULInsert1
图1:不同的降解速率与保修承诺,在任意时间尺度
改善用于估计光伏寿命的理论方法,有必要理解各种环境条件和所观察到的影响,每个这些条件对光伏组件之间的交互。这要求从不同位置的性能数据的收集,数据的分析,以确定故障的可能的根本原因。表1列出了各种环境参数,并显示一些观察到的影响是导致光伏组件故障。
ULInsert2
光伏组件的耐用性是其设计的副产品。 PV模块的可靠性,另一方面,依赖于用于制造模块的过程的质量和完整性。在材质或制造工艺甚至微小的变化会影响组件的可靠性。
光伏组件给定的标准要求的测试和认证通常侧重于验证的基本设计要求已得到满足。不同的电池的长期应力测试和测试到失败的协议已经被提出来验证光伏modules.5的耐久性,6,7
人们常常想当然地认为这样的长期测试也评估了光伏组件的可靠性,但可靠性测试验证产品一贯的原始设计参数范围内产生。可靠性测试增加了信心,生产质量,并通常需要更少的时间和成本不到耐久性试验。
是有效的,可靠的测试需要检查不止一两个样品。一种基于行业标准,例如ISO2859-1,8可以提供关于如何选择和评价制作的样品,以及可用于确定批次测试产品是否应该被接受的条件的指导。基于样本接受和拒绝的实际历史,或多或少严格的抽样方案可以使用。
然而,鉴于其在光伏系统的可靠运行的重要性,更先进的质量检查是必要的,当涉及到光伏组件。表2示出在ISO2859-1,包括测试的范围内
通过检查水平(S1-S4和G1-G3)和光伏项目的大小来进行评价的样本数
验收质量水平(AQL)
允许不合格的样品的百分比
ULInsert3
的样本数来进行评估,假定产品的变化的统计分布。在AQL定义了信心,接受或拒绝某一批次的样品。对于这样安全一些关键的测试中,低的AQL(如0.1等)会表明不容忍失败(零宽容失败)。在其他试验中,如那些用于评估像错位细胞的视觉缺陷,更高AQL值是可以接受的。行业标准往往提供基本的合格/不合格。
注:该表显示建议的检查水平,需要对每一个测试,并允许根据ISO2859-1的模块故障数的样本数。使用240W的模块条目“一)”指的是1MW工厂“,二)”,以一个10兆瓦的工厂,和“c)”到50MW电厂)0.15
UL自身的一套测试产品的包括上述短期质量的测试,以及各试验以评估长期耐久性或试验对不合格限值的扩展版本。表3提供了概述和各试验的简要说明以及光伏技术,其中每个测试适用。
ULInsert4
选定的测试细节
以下各节讨论选定的光伏组件可靠性测试,并说明他们在评估光伏组件可靠性的潜在价值。要注意,它是重要的,而这些测试不是过于费时或昂贵,它们要求的样本的最小数目的评估,以便产生统计上显著结果。
Flash测试
闪光测试是一种有效的方式,以不确定性的一个给定的范围内验证光伏组件的输出功率。的不确定性,主要是从一个给定的PV模块的自校准链的光谱响应,所使用的光源和普通的测量不确定性的驱动。最后的不确定性通常是恒定的,但前两个可能导致在绝对测量值的显著影响,特别是对于薄膜的技术。
除了这些限制,闪存测试可以用于研究与模块的可靠性相关的有以下几个方面:
从预处理产生的初始功率损失的测定
生产闪存名单核查
的铭牌额定值验证
这三个因素是任何有效的估产的关键。实现的信心估产甚至更高水平,这是最好的依靠测量数据从将要使用的太阳能电池的初始功率损耗的实际PV组件。平均初始降解通常低于多晶细胞的1%,但可以大到5%,单晶硅电池。图2a示出了在初始功率损耗的实际值的电位差。然而,与几千模块的安装,这个扩展被平均掉了所有的模块。
生产闪存列表验证是在选择光伏组件制造商的重要的第一步。生产闪光列表验证比较而测得的功率输出参数从生产用标记的值,以及那些从第三方测量而得。此验证验证的光伏组件制造商的校准链。闪存名单核查是在至少20个人的模块通常进行的,以确保缺陷正态分布,降低不确定性。通常更高的测量的不确定性,应考虑到在更少的模块正在测试例。
光伏组件自己的铭牌额定值的基础上,通常出售。那对PV模块铭牌出现的瓦特额定值是用于在进行能源产量的模拟,这意味着准确铭牌是一个关键因素,在实现能源产量预测对于给定的安装。符合标准EN50380和UL4730的要求,<SUP9,10日,出现在铭牌额定值必须考虑所有的初始降解或光浸润效果。因此,光伏组件应于测量之前稳定,测定应与铭牌上显示的等级进行比较。
ULInsert5
的铭牌额定值的例子示于图2b。在这种情况下,测得的实际功率是约2.2%以下表示铭牌额定值。这样的差异可能会导致预期与实际输出功率之间的差距。
电致发光:故障检测和测绘
第二种评估方法中,电致发光(EL)的成像,主要用于晶体硅光伏组件,因为没有广泛接受模块的缺陷是可见使用这种method.11,12有几种不同类型的缺陷的类型的可识别带EL成像,每个都有自己的根源和性能的影响。按照常用的方法评估EL图像可以提供有关光伏组件可靠性的有用信息。
图3显示了两个模块,每个模块有不同数量与不同程度的裂缝。模块类似于在模块中描绘没有。 1顷通常可接受的,并且可以可靠地产生动力。类似于模块二号描绘模块通常表现出非活性区后很短的时间周期,从而导致严重的功率损失。
ULInsert6
图4:采用电致发光检测出货量的生产变化故障映射。出货#1显示正常,随机分布的一些缺陷。与此相反,装运没有。图2示出了一些局部非常高数目的缺陷,例如:5X更多的缺陷细胞J-5。
通过从单一批评估多个图像,因此能够确定从数量和缺陷分布的质量的总体水平。这种评价的图示示于图4。每个装运包含的模块数相同。在装运第1号,只有很少的随机分布的缺陷被确定,代表一个可以接受的结果。但是,在装运第2号,有缺陷的模块的数量急剧增加,并且缺陷和电池出现裂缝集中在该区域I4到J5。
ULInsert7
总之,这些观察指向显著问题,无论是在制造过程中,已完成的模块,或者两者的输送。在任何情况下,结果在装运描绘
2号是不能接受的,并进一步调查是必要的,以确定根本原因。其他行动包括在安装之前的EL检查所有模块,或更频繁的检查,并已投产的光伏系统的测试。
潜在的致衰退
目前,潜在变性(PID)主要与晶体模块相关联。虽然一些晶体硅组件制造商现在提供光伏模块,据称有抗PID,PID仍然是一个悬而未决的问题。努力解决的PID通过使用不同的测试程序和可比性的指标,以及缺乏对PID和恢复的影响之间的关系的数据被进一步复杂化。
不幸的是薄膜光伏模块也并不总是耐势与地。早期的薄膜模块表现出许多问题与透明导电氧化物(TCO),腐蚀(也称条形图腐蚀),清晰可见的缺陷。但今天的薄膜组件也可以表现出严重的PID,也就是不容易通过标准测试protocols.13检测条件
PID检测的焦点可以变化,这取决于所期望的结果。然而,一些选项包括:
屏光伏组件的PID易感性
发货到shipmentverification的PID易感性
模块物料的筛分(细胞和密封剂)
标准测试条件(STC)和PID测试后的低光性能测试
在此列表中的第一个项目似乎是显而易见的,但其他选项可以提供进一步的见解长期模块的可靠性,使更迅速的行动,查明并处理的PID。
图5示出了三种类型从不同的制造商模块的PID筛选试验的结果。 1型模块显示随着时间的推移有不同的敏感性几乎是线性下降。所示的2型模块实际上是一个类型1的模块的一个极端的情况下,因为它很快达到可能降解的100%,并且不能进一步随时间降解。类型3模块中的PID测试的第一阶段通常是稳定的,但开始快速降解一旦达到潜在应用的特定阈值。关键的是要找出的一般行为(类型1或3)下连续实验室电压应力试验,也进行调查,模块和可能的系统相关options.16的恢复方面
ULInsert8
因为光伏组件可以产生这样广泛不同的结果,来设定合理的测试参数是很重要的。选参数可能依赖于该模块的类型或测试的实际范围的先验知识,例如,质量检查或耐久性调查。 UL自身的默认测试程序由通过导电箔片施加电势,从而在整个模块的均匀的筛选及其所有太阳能电池的受试者模块系统电压两周。这种默认的参数设置可以调整和定制,以满足特定项目的特定需求。
总结和结论
在竞争日益激烈的市场中,厂商预计,为客户提供提供符合承诺的性能规格的光伏组件。一致的模块的可靠性依赖于制造过程的质量和完整性,甚至是很小的变化可以的组分和妥协的PV系统性能的可靠性产生不利影响。一个有效的,在统计学上相关的可靠性测试协议可以帮助识别不符合设计规范的模块,从而为客户提供更大的保证,预计光伏发电系统的性能实际上是可以实现的。
UL认证巩固了多年的光伏产业研究,开发行之有效的科学测试程序来筛选光伏组件的可靠性,性能和安全性。光伏组件UL的性能和可靠性,服务提供行业标准测试的第三方证据,以评估在制造过程中,其中还包括光伏组件工厂运营技术检验的一致性。附加试验可以进行证明的长方面讲对PV模块的性能和安全性的影响。